

mulle-objc: investigating the pros and cons of inlining mulle_objc_object_call
Continued from mulle-objc: divining the guts of message sending.
As was shown in a previous article the optimal case for the method-cache lookup occurs, when the selector indexes directly to its matching cache entry. In a warmed up cache the statistical expectation of such a first stage cache hit is ~75%. [1]
To test out the inlining potential of this first stage, I wrote a stripped down
version of mulle_objc_object_call:
code.cpp.
This is the most interesting part from that file (slightly edited for readability):
static inline void  *call( void *obj,
                           uintptr_t methodid,
                           void *parameter)
{
   int                     index;
   void                    *(*f)( void *, uintptr_t, void *);
   struct cache            *cache;
   struct cacheentry       *entries;
   struct cacheentry       *entry;
   struct xclass           *cls;
   uintptr_t               offset;

   // self == nil check
   if( __builtin_expect( ! obj, 0))
      return( obj);

   // get class from object (isa)
   cls = ((xclass **) obj)[ -1];

   // get cache from class via cache-pivot
   entries = cls->entries;
   cache   = (cache *) &((char *) entries)[ -(int) offsetof( struct cache, entries)]);

   // get index into cache entries by masking the selector
   offset  = methodid & cache->mask;
   entry   = (cacheentry *) &((char *) entries)[ offset];

   // use default functionpointer if no cache hit (else path)
   if( __builtin_expect( (entry->uniqueid == methodid), 1))
      f = entry->functionpointer;
   else
      f = cls->functionpointer;

   return( (*f)( obj, methodid, parameter));
}
As you can see the first-stage “hit” case exits mulle_objc_object_call
via entry->functionpointer. In the “miss” case method lookup and execution
is deferred to a second stage called via cls->functionpointer.
So the second stage of mulle_objc_object_call isn’t inlined anymore.
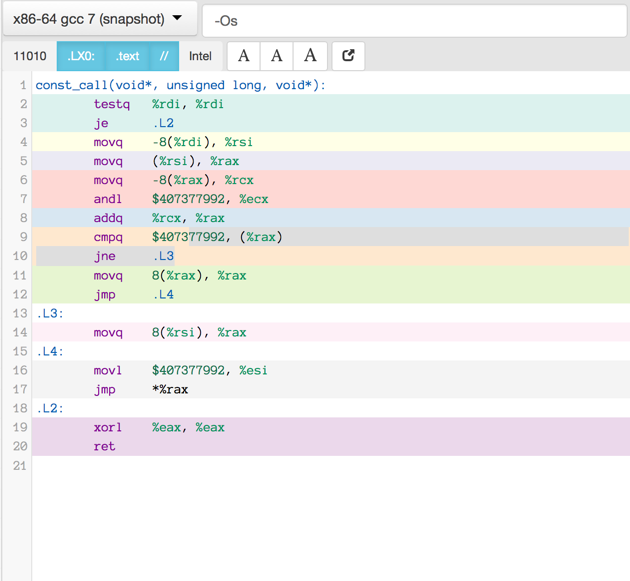
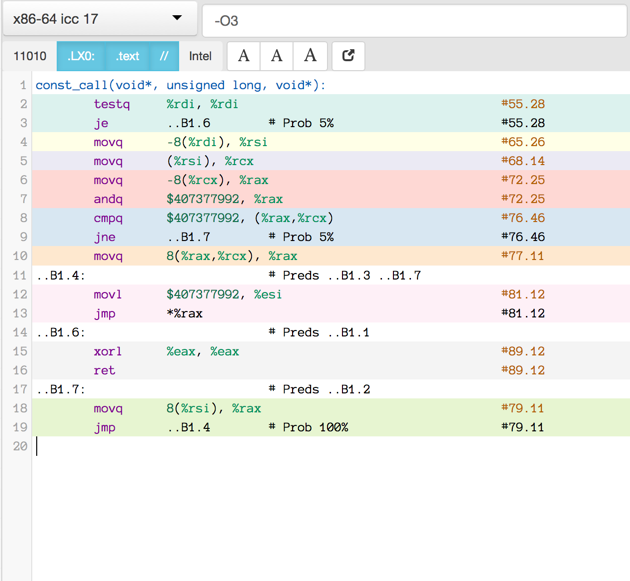
Compiler produced assembler code
Here is the assembler output produced by a motley crew of compilers.
See mulle-inline-cache-lookup README.md how this was done.
All of the compiler used -O3, except where it is noted that they used -Os:
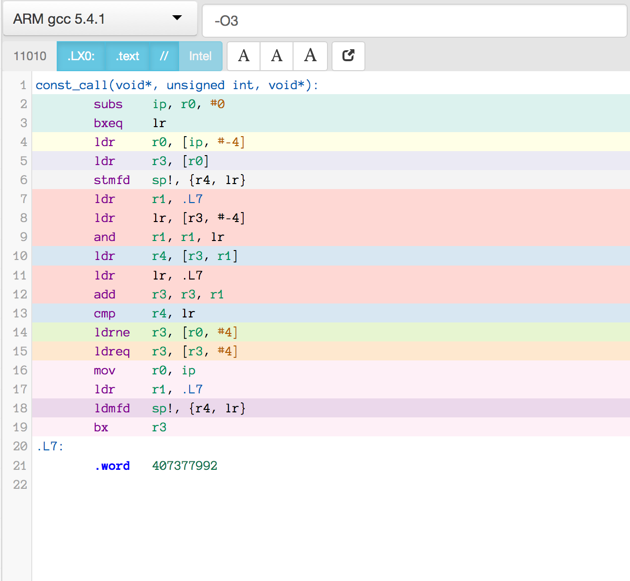
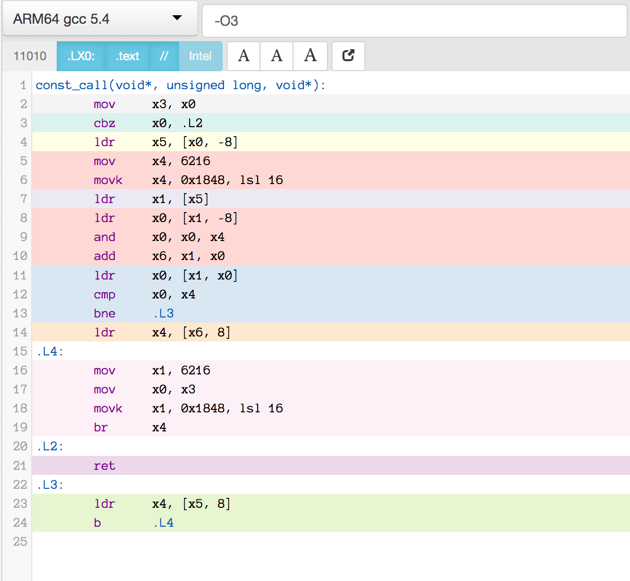
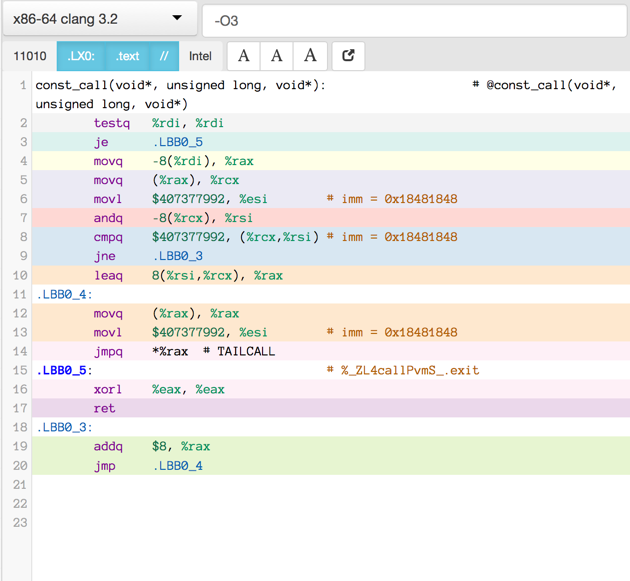
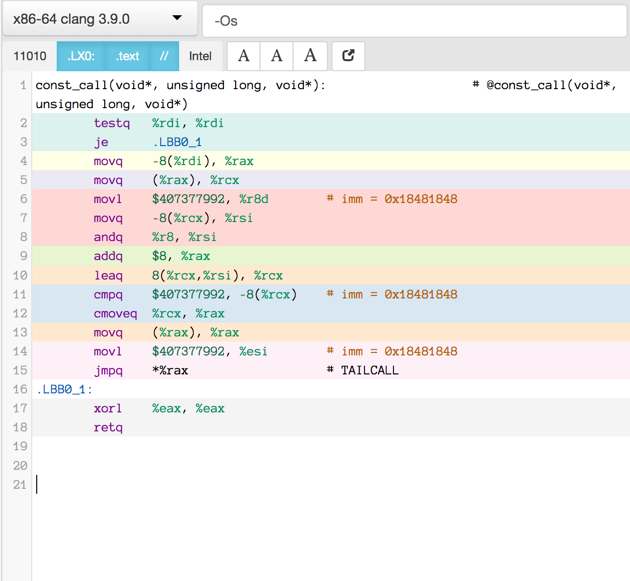
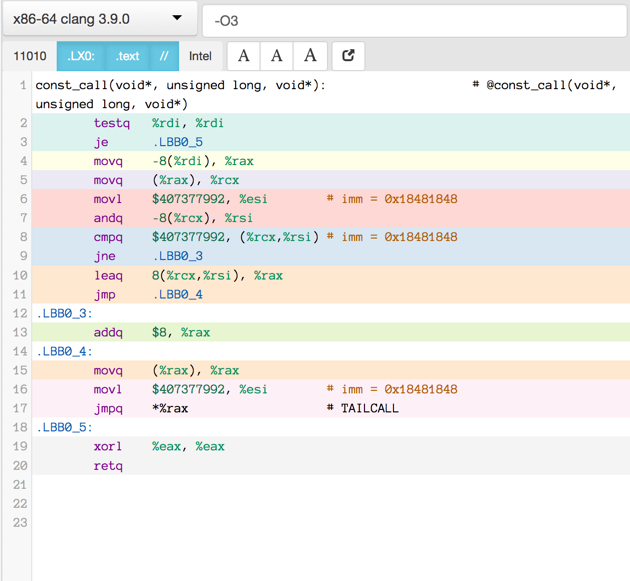
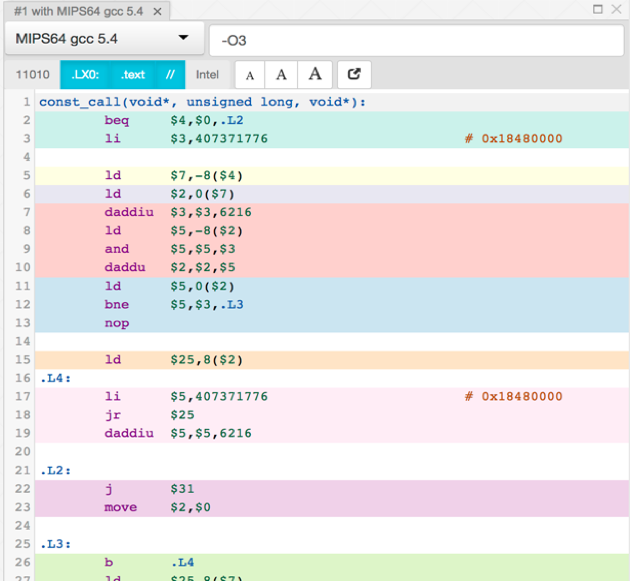
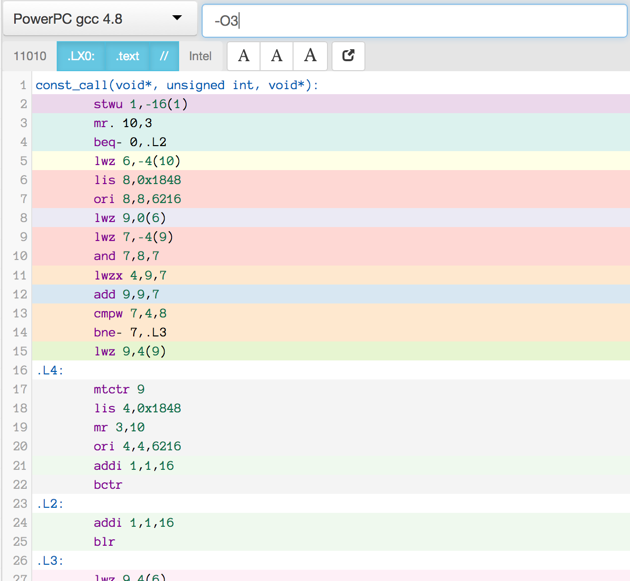
You can click on an image to get the text file.
Benchmarking
I then benchmarked the assembler codes of the x86_64 compilers and I also
benchmarked some handwritten code. The project is available on
mulle-inline-cache-lookup
so you can reproduce my findings:
| Source | Size (bytes) | Best Hit Run | Best Miss Run | Weighted Average |
|---|---|---|---|---|
| nat-call-4.s | 46 | 1,03 | 1,03 | 1,0197 |
| nat-call-3.s | 51 | 1,03 | 1,16 | 1,0509 |
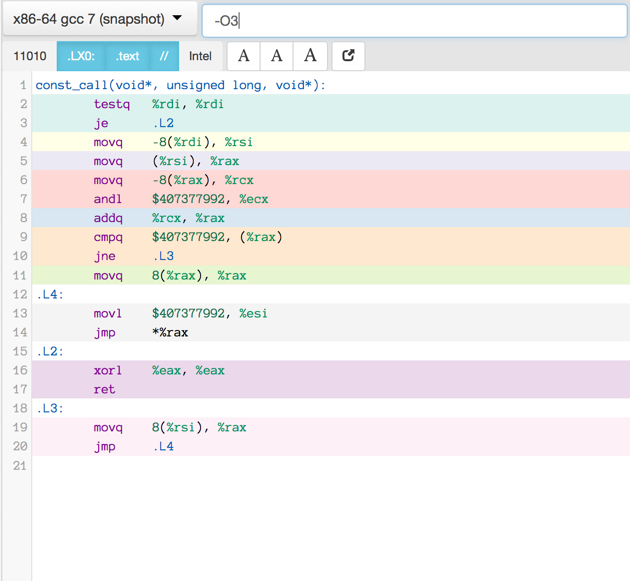
| gcc-7.0 | 65 | 1,03 | 1,41 | 1,1109 |
| clang-3.2 | 66 | 1,03 | 1,42 | 1,1133 |
| clang-3.9-Os | 63 | 1,16 | 1,16 | 1,1484 |
| clang-3.9 | 66 | 1,16 | 1,16 | 1,1484 |
| gcc-7.0-Os | 65 | 1,16 | 1,16 | 1,1484 |
| nat-call-1.s | 66 | 1,16 | 1,16 | 1,1484 |
| nat-call-2.s | 57 | 1,16 | 1,16 | 1,1484 |
| icc-17.0 | 64 | 1,16 | 1,54 | 1,2396 |
The weighted average is 0.75 * hit + 0.25 * miss. That fits the proposition, that the hit case is executed 75% of the time.
So the speed difference between human assembler and compiler assembler is 10%. The size improvement by human assembler is even better, it’s 30%.
10%, that’s about the speed improvement you’d get, if you spend an additional €240 on an iMac to get the faster processor. I’m just sayin…
Machine vs Human
It is actually quite disappointing, that the compiler can’t come close here, since mulle-objc is C-only, and does not use assembler code. The piece of C-code to optimize is in my opinion very simple, what could possibly go wrong ?
Let’s have a look at the best runner-up “gcc-7.0” to see where the problems are:
        testq   %rdi, %rdi
        je      .L2

        movq    -8(%rdi), %rsi
        movq    (%rsi), %rax
        movq    -8(%rax), %rcx
        andl    $407377992, %ecx    # 32 bit constant loaded
        addq    %rcx, %rax
        cmpq    $407377992, (%rax)  # same 32 bit constant used again
        jne     .L3                 # little jump
        movq    8(%rax), %rax
.L4:
        movl    $407377992, %esi    # and same 32 bit constant used yet again
        jmp     *%rax
.L2:
        xorl    %eax, %eax
        ret
.L3:
        movq    8(%rsi), %rax       # isn't that very similiar to 8(%rax) ?
        jmp     .L4                 # another little jump
Background Information
- used by Unices and OS X - lists the available registers for function call parameters. I’ve annotated them as they are used by mulle-objc:
Available registers
- %rdi # self
- %rsi # _cmd
- %rdx # _param
- %rcx # free
- %r8 # free
- %r9 # free
Why doesn’t the compiler store the constant $407377992 (which is the selector
0x18481848) in an available register like $r9 for example ? That should save
around 8 bytes of instruction space and it isn’t slower.
The second problem is, that I carefully designed the offsets so
that the function to call is either in 8(%rsi) (the class) or in 8(%rax)
(the cache entry). This opportunity is unfortunately also not
exploited.
Human vs Machine
So here is nat-call-4.s it hasn’t proven to be slower, quite the opposite.
It folds the three immediate constants into an available register $r9 and
replaces the conditional jump instructions with a cmove.
0000  testq %rdi, %rdi
0003  je .L2
0009  movq  -0x8(%rdi), %r9
000d  movq  (%r9), %rax
0010  movq  -0x8(%rax), %rcx
0014  movl  $0x18481848, %esi
0019  andl  %esi, %ecx
001b  addq  %rcx, %rax
001e  cmpq  %rsi, (%rax)
0021  cmoveq %rax, %r9
0025  movq  0x8(%r9), %rax
0029  jmpq  *%rax
.L2:
002b  xorl  %eax, %eax
002d  retq
Calculating the overhead for mulle_objc_object_call
These 46 bytes worth of instructions would actually reduce even further in “real” life. Why ? In any method until reassigned, self is known to be non nil [2]. Also everytime you write code like this
   while( obj = [rover nextObject])
   {
      [obj call];
   }
It is known by the compiler that at [obj call] obj can not be nil.
This means that in those cases the inlining function can ignore the nil test
case. Furthermore the constant
assignment in this code is really part of the user method call and not
overhead, compared to a conventional method call.
So removing lines 0000,0003,002b,002d for the nil check and 0014
for the constant, the code gets reduced to:
0000  movq  -0x8(%rdi), %r9
0004  movq  (%r9), %rax
0007  movq  -0x8(%rax), %rcx
000b  andl  %esi, %ecx
000d  addq  %rcx, %rax
0010  cmpq  %rsi, (%rax)
0013  cmoveq   %rax, %r9
0017  movq  0x8(%r9), %rax
001b  jmpq  *%rax
Which is 29 bytes. That could be, in a perfect compiler world, the
best-case overhead for inlining the first stage of mulle_objc_object_call
on x86_64.
[1] This is a function related to the relative emptiness of the cache, which is 25% empty entries minimum and the bit diffusion in the selectors.
[2] Why ? Because the method is never called in the nil case.
Continue to mulle-objc: fast methods make
mulle_objc_object_calleven faster.
Post a comment
All comments are held for moderation; basic HTML formatting accepted.