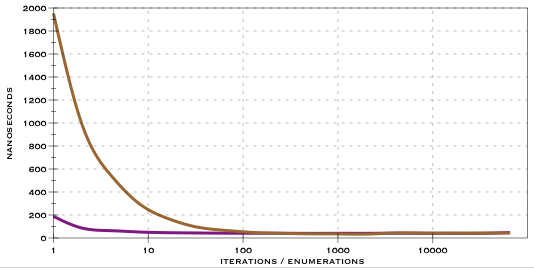
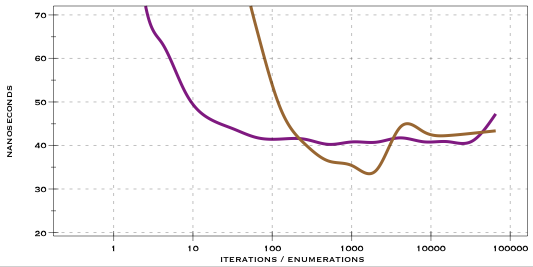
The brown line is enumeration with <tt>-[NSEnumerator nextObject]</tt>
The purple line is iteration with <tt>-[NSArray objectAtIndex:]</tt>

whitenoise wrote:What's the disparity between the two charts?
Return to “Foundation & Objective-C”
Users browsing this forum: No registered users and 1 guest